

TL;DR:
- Learning analytics transforms raw data into actionable insights to improve student outcomes.
- Effective use requires strategic planning, stakeholder engagement, and ethical data management.
- Properly implemented analytics can boost retention, personalize learning, and optimize resource allocation.
Schools collect more student data than ever before, yet most of it sits unused in spreadsheets and system logs. The gap between data collection and actionable insight is wide, and it costs students real opportunities. Learning analytics is defined as the collection, analysis, interpretation, and communication of data about learners for actionable insights. That definition sounds simple, but the practice is far more nuanced. This guide cuts through the confusion, explains what learning analytics actually involves, and shows educators and administrators how to apply it in ways that produce measurable results.
Table of Contents
- Defining learning analytics
- Key data sources and analytic techniques
- Benefits and evidence of learning analytics in action
- Pitfalls, ethical concerns, and implementation challenges
- Best practices for successful learning analytics adoption
- A practitioner’s perspective: what most guides miss about learning analytics
- Level up with AI-powered analytics solutions
- Frequently asked questions
Key Takeaways
| Point | Details |
|---|---|
| Data to insight | Learning analytics transforms scattered educational data into actionable insights for teachers and leaders. |
| Practical starting points | You can start with simple LMS data and progress toward AI-powered analytics at your own pace. |
| Strong ROI possibilities | Well-implemented learning analytics boosts retention rates and operational efficiency according to research. |
| Ethics and equity matter | Addressing privacy, bias, and stakeholder engagement is critical for sustainable adoption. |
| Plan for people | Building cross-functional teams and focusing on practical teaching change—not just technology—are core to long-term impact. |
Defining learning analytics
Learning analytics is not the same as pulling a grade report or reviewing login counts in your learning management system. Those activities produce raw data. Learning analytics turns that data into decisions.
“Analyzing and communicating data about learners is the foundation of learning analytics, but the real goal is improving the conditions under which learning happens.”
The four core components of learning analytics are:
- Data collection: Gathering structured and unstructured information from multiple sources across the learning environment
- Analysis: Applying statistical or computational methods to identify patterns and relationships
- Interpretation: Translating patterns into meaning that educators and administrators can actually use
- Informed action: Using those interpretations to adjust instruction, policy, or support services
This is what separates learning analytics from simple reporting. A grade report tells you what happened. Learning analytics tells you why it happened and what you should do next.
The distinction matters enormously in technology-driven teaching environments, where data flows from multiple platforms simultaneously. Without a structured analytic process, that data creates noise rather than clarity. Understanding AI’s impact in education helps contextualize why this field has grown so rapidly. Institutions that treat analytics as a strategic function, rather than an IT task, consistently see stronger outcomes for both students and staff.
Key data sources and analytic techniques
Effective learning analytics starts with knowing where your data lives and what methods can make sense of it.
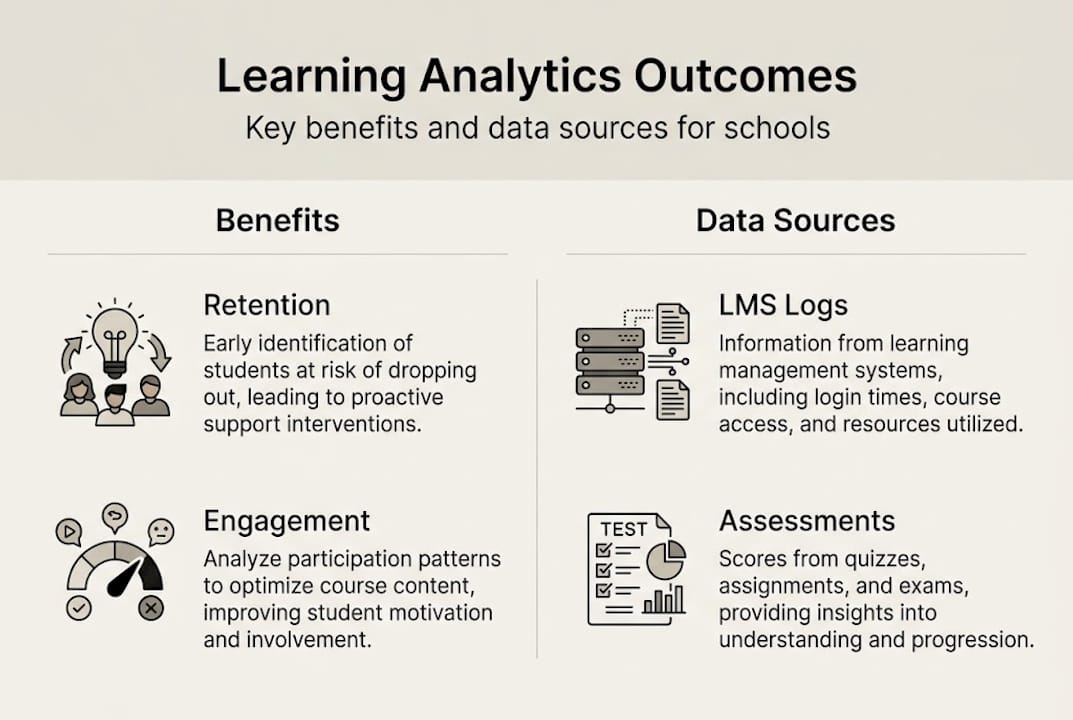
Key data sources include:
- LMS logs: Click paths, time-on-task, forum activity, and submission timestamps
- Assessments: Formative quizzes, standardized tests, and performance rubrics
- Surveys: Student satisfaction, self-reported engagement, and learning preference data
- Student interactions: Office hours records, advising notes, and peer collaboration data
Data sources including LMS logs, assessments, and surveys, combined with advanced techniques like machine learning, form the backbone of modern learning analytics programs.
Once you have your sources identified, analytic techniques determine what you can learn from them:
| Analytic type | Definition | Use case | Popular metrics |
|---|---|---|---|
| Descriptive | Summarizes what has already happened | Monitoring attendance trends | Pass rates, login frequency |
| Predictive | Forecasts future outcomes based on patterns | Identifying at-risk students | Risk scores, completion probability |
| Prescriptive | Recommends specific actions to improve outcomes | Personalizing learning pathways | Intervention triggers, resource recommendations |
Applying machine learning in education takes predictive and prescriptive analytics to a higher level of accuracy. These models can surface patterns that human reviewers would never catch manually. Tools built around personalizing learning with AI use these techniques to adapt content delivery in real time based on individual student behavior.

Reviewing ROI benchmarks in learning analytics confirms that institutions with mature analytic practices see compounding benefits over time.
Pro Tip: Start with descriptive analytics on one data source, such as LMS login frequency, before expanding to predictive models. Early wins build staff confidence and reveal data quality issues before they scale.
Benefits and evidence of learning analytics in action
Knowing what data and methods are involved, it is important to see what schools can actually achieve when applying learning analytics effectively.
The evidence is strong. Retention prediction accuracy of 80 to 90 percent in higher education represents a significant institutional gain, and that number reflects real students who stayed enrolled because an intervention reached them in time.
| Outcome area | Typical institutional gain | Example application |
|---|---|---|
| Student retention | 10 to 20 percent improvement | Early warning systems flagging disengagement |
| Personalization | Adaptive pathways for 30 to 50 percent of learners | AI-driven content recommendations |
| Resource allocation | 15 percent reduction in wasted support hours | Targeted tutoring based on risk scores |
| Teaching adaptation | Faster curriculum revision cycles | Instructor dashboards showing concept mastery gaps |
In K-12 settings, districts have used attendance and assessment data to identify students at risk of falling behind as early as the second week of a semester. In higher education, universities have deployed predictive dashboards that alert advisors when a student’s engagement pattern signals dropout risk weeks before a missed deadline.
The main educational outcomes enhanced by learning analytics include:
- Early warning systems that flag at-risk students before they disengage completely
- Resource targeting that directs tutoring, advising, and financial aid to students who need it most
- Teaching adaptation that allows instructors to adjust pacing and content based on real-time mastery data
- Personalized learning pathways that match content difficulty and format to individual student profiles
- Institutional planning that uses trend data to inform curriculum design and staffing decisions
Exploring learning analytics tools that align with your existing systems is a practical first step toward capturing these benefits.
Pitfalls, ethical concerns, and implementation challenges
While potential gains are clear, responsible implementation means being aware of practical hurdles and ethical questions.
Common pitfalls include:
- Misinterpreted data: A student logging in frequently does not mean they are learning effectively
- Overreliance on engagement metrics: Time-on-platform is a proxy for learning, not a measure of it
- Equity blind spots: Predictive models trained on historical data can reinforce existing achievement gaps
- Data silos: Disconnected systems produce incomplete pictures that lead to flawed conclusions
Challenges including data silos, platform inaccuracies, misaligned metrics, and ethical concerns are well documented across institutions of all sizes. These are not edge cases. They are the norm for organizations in the early stages of analytics adoption.
On the ethical side, student privacy is non-negotiable. FERPA (the Family Educational Rights and Privacy Act) governs how institutions in the United States handle student records, and learning analytics data falls squarely within its scope. Predictive models also carry bias risk: if historical data reflects systemic inequities, the model will too.
“Human-centered and theory-informed implementation is essential to maximize impact and avoid reinforcing bias in learning analytics systems.”
Reviewing proven edtech adoption strategies can help your institution avoid the most common implementation mistakes before they become costly.
Pro Tip: Build a cross-functional team that includes IT staff, instructional designers, classroom teachers, and a privacy officer. No single department has all the expertise needed to implement learning analytics responsibly.
Best practices for successful learning analytics adoption
Only with a grounded, step-by-step approach can schools turn analytics from buzzword into real benefit. Here is how to start right.
Expert guidance recommends starting with clear educational goals and human-centered design before selecting any tool or platform. Technology should serve pedagogy, not the other way around.
Follow these steps to build a sustainable learning analytics program:
- Define your educational goals first. What specific student outcomes do you want to improve? Retention, course completion, and skill mastery are measurable starting points.
- Audit your existing data sources. Map what data you already collect, where it lives, and whether it is clean and consistent enough to analyze.
- Start with descriptive analytics. Build dashboards that summarize current performance before attempting predictive modeling.
- Engage all stakeholders early. Teachers, advisors, students, and parents all have a stake in how data is used. Transparent communication builds trust.
- Establish data governance policies. Define who can access what data, for what purpose, and under what conditions.
- Train your staff. Analytics tools are only useful if educators know how to interpret and act on the insights they produce.
- Review and adjust regularly. Set a quarterly review cycle to assess whether your analytics program is meeting its stated goals.
For institutions ready to scale, reviewing AI adoption guidance for schools provides a structured framework for moving from descriptive to predictive analytics responsibly. A detailed walkthrough of implementing AI for education covers the technical and organizational steps in practical terms.
A practitioner’s perspective: what most guides miss about learning analytics
Most learning analytics initiatives fail not because of bad data or wrong tools. They fail because the institution treats the project as a technology upgrade rather than an instructional transformation.
We have seen this pattern repeatedly. A school invests in a sophisticated analytics platform, trains IT staff to maintain it, and then wonders why classroom outcomes do not change. The answer is almost always the same: teachers were not involved in defining what the data should do for them.
Real change comes from aligning analytics with local context. A risk score that works well at a large research university may be completely misleading at a rural community college with a different student population and support structure. Copying another institution’s model without adapting it to your context is a recipe for frustration.
The most overlooked factor in every implementation we have encountered is planning for ongoing reflection. Most schools focus heavily on the rollout and almost nothing on what happens six months later. Analytics is not a one-time deployment. It requires regular recalibration, honest conversations with stakeholders, and a willingness to change course when the data tells you something uncomfortable.
Exploring AI strategies in education that center teacher empowerment alongside data capability is where sustainable programs begin.
Level up with AI-powered analytics solutions
Ready to move from understanding to action? At Airitual, we work directly with educational institutions to translate learning analytics concepts into practical, scalable programs. Whether you are just starting out or looking to expand existing capabilities, our resources are built for educators and administrators who want results, not just reports.
Use our AI for education checklist to evaluate tools that fit your institution’s specific needs and technical readiness. For a structured path from planning to deployment, our guide on AI-powered education implementation walks you through every stage. And if you want to ensure your integration follows proven methods, our AI integration best practices resource covers efficiency, engagement, and ethical use in one place. Schedule a FREE Strategy Session with our team to discuss your institution’s goals.
Frequently asked questions
What problems does learning analytics help solve?
Personalization and early intervention are among the most impactful benefits, helping schools identify at-risk students before they disengage and allocate support resources where they are needed most.
Do you need advanced technical skills to start using learning analytics?
No. You can begin with descriptive analytics using existing LMS dashboards, and build toward more sophisticated models as your team’s confidence and data literacy grow.
What privacy risks should schools consider?
Privacy and bias are the two most critical concerns, requiring strict compliance with FERPA, transparent data governance policies, and regular audits of predictive models for discriminatory patterns.
How is learning analytics different from traditional assessments?
Traditional assessments capture performance at a single point in time, while learning analytics goes beyond grades to draw on continuous, multi-source data that informs instruction in real time rather than at the end of a term.
Can learning analytics really improve outcomes for all students?
Yes, when implemented with attention to equity and context. Analytics improves retention and personalization across diverse student populations, provided institutions build in regular feedback loops and adjust models to reflect their specific community.
Recommended
- Future of AI in Schools 2026: Transforming Learning | Artificial Intelligence
- Machine Learning in Education: Enhancing Outcomes | Artificial Intelligence
- Step-by-step guide to implementing AI-powered education | Artificial Intelligence
- 10 AI-powered teaching tips that boost results in 2026 | Artificial Intelligence
- Data-driven strategi 2026: steg för steg guide | Growth Nordic
Recent Comments